Posts

Exploring the Power of the 10 EMA and 21 EMA Crossover Trading Strategy

Image
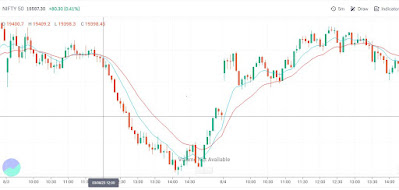
  The 10 EMA (Exponential Moving Average) and 21 EMA crossover trading strategy is a popular and effective tool for traders seeking to identify trends and potential buy/sell signals in the financial markets. This strategy harnesses the dynamic nature of EMAs to provide insights into market momentum and trend changes. EMA crossovers occur when the faster 10 EMA crosses above or below the slower 21 EMA on a price chart. When the 10 EMA crosses above the 21 EMA, it generates a bullish signal, indicating potential upward momentum. Conversely, when the 10 EMA crosses below the 21 EMA, a bearish signal suggests possible downward pressure. This strategy offers several benefits. First, it provides traders with a visual representation of short-term and medium-term trends, aiding in quick decision-making. Second, the exponential weighting of EMAs places more emphasis on recent price movements, enabling faster reactions to changing market conditions. However, like any strategy, it's important

Leveraging Open Interest Data in Options Trading: A Roadmap to Success

Image
Using open interest (OI) data in option trading can provide valuable insights and help you make more informed decisions. Open interest refers to the total number of outstanding option contracts in the market for a specific strike price and expiration date.  Here are some ways to use OI data to potentially profit from option trading: Identify liquidity and popularity: Higher open interest typically indicates more liquid and popular options contracts. These options are easier to trade, as there is more buying and selling activity, reducing the bid-ask spread. Trading in liquid options can help you enter and exit positions with better pricing. Spot potential trend reversals:  Changes in open interest can indicate shifts in market sentiment. Increasing open interest combined with rising prices may suggest a bullish trend, while increasing open interest with falling prices could indicate a bearish trend. Conversely, decreasing open interest might signal a potential trend reversal. Confirm b

How to Select the Perfect Stock for Intraday Trading

Image
Intraday trading is a popular form of trading in the stock market, where traders buy and sell stocks within the same trading day. Intraday traders aim to make profits by taking advantage of small price movements in the market. However, selecting the right stock for intraday trading can be a challenging task, and requires a lot of research and analysis. In this blog, we will discuss some essential factors that you need to consider while selecting a stock for intraday trading. Liquidity Liquidity is one of the most important factors to consider while selecting a stock for intraday trading. Liquidity refers to the ability of a stock to be bought and sold quickly, without affecting the price of the stock. Stocks with high liquidity are easier to buy and sell, and are less risky for intraday trading. Blue-chip stocks, which are large and well-established companies, are usually the most liquid stocks in the market. Volatility Volatility is the degree of variation of a stock's price over

Heiken Ashi Candle Trading Strategies

Image
Candlestick charts are an essential tool in technical analysis, and Heiken Ashi charts are one of the most popular types of candlestick charts. The Heiken Ashi candlestick chart is known for its unique representation of price trends and patterns, which can be used to develop trading strategies. In this blog post, we will discuss the various Heiken Ashi candle trading strategies that traders can use to improve their trading outcomes. What is Heiken Ashi Charting?  Before diving into the trading strategies, let's first understand what Heiken Ashi charting is. Heiken Ashi is a type of candlestick chart that is used to filter out market noise and help traders identify trends more easily. In traditional candlestick charts, each candlestick represents the price movement for a specific period, such as one hour or one day. However, in Heiken Ashi charts, each candlestick represents the average price movement over a specific period. The Heiken Ashi chart is constructed using a modified calc

Moving Average Trading Strategies

Image
Moving averages are one of the most widely used technical indicators in the financial markets. They are used to identify trends and help traders make informed decisions. A moving average is a trend-following indicator that smooth's out price fluctuations by averaging the price of a security over a specific time period. In this blog post, we will discuss moving average trading strategies that can be used by traders to make profitable trades in the financial markets. What is Moving Average? A moving average is a widely used technical indicator that smooth's out price fluctuations by averaging the price of a security over a specific time period. A moving average is a lagging indicator that follows the price action of a security. Moving averages are used to identify trends, support and resistance levels, and potential entry and exit points. Moving averages can be calculated for any time frame, from minutes to months. Types of Moving Averages: There are three types of moving average

Trading strategies for beginners

Image
If you are new to trading and want to learn the basics of trading strategies, then you have come to the right place. In this blog, we will discuss some trading strategies that are suitable for beginners. We will explain what these strategies are, how they work, and how you can use them to make profitable trades. Buy and Hold Strategy: The buy and hold strategy is the simplest trading strategy that is suitable for beginners. This strategy involves buying a stock and holding onto it for a long time, regardless of market fluctuations. This strategy is based on the belief that the stock market tends to rise over the long term. To use this strategy, you need to choose a stock that has a strong history of growth and potential for future growth. You should also consider the company's financials, management, and market position. Once you have chosen a stock, buy it and hold onto it for several years. Trend Following Strategy: The trend following strategy involves buying stocks that are tre

The Psychology Behind Successful Trading

Image
Trading can be a rewarding career if done correctly. Successful traders do more than simply monitor charts and economic news. They also have a solid understanding of psychology and the role it plays in trading. In this blog, we'll explore the importance of psychology in trading and how it can impact your success as a trader. Understanding the Psychology of Trading Trading can be an emotional experience, and it's important to understand the psychology behind it. The market is unpredictable and constantly changing, and it can be easy to let emotions take over. Fear, greed, and even overconfidence can cloud your judgment and lead to poor decisions. A trader's mindset can be the difference between a successful trade and a losing one. Fear and Greed Fear and greed are two of the most common emotions that can impact a trader's decision-making process. Fear can cause traders to sell their positions prematurely, while greed can cause them to hold on to a position for too long i