You will find useful information on stock selection based on strong fundamental and technical analysis here. Follow us to learn about trading and investing. We are devoted entirely to growing your extra income.
Share market is closed today
Get link
Facebook
Twitter
Pinterest
Email
Other Apps
-
Market is closed today on occasion of Guru Nanak Jayanti.
In the fast-paced world of trading, having a reliable strategy can make all the difference. One strategy that has gained popularity among both novice and seasoned traders is the 5 EMA (Exponential Moving Average) and 10 EMA crossover strategy. This straightforward yet effective approach can help traders identify potential entry and exit points, enabling them to navigate the markets with more confidence. The concept behind the strategy is simple: it involves two Exponential Moving Averages – the 5 EMA and the 10 EMA – plotted on a price chart. The EMA gives more weight to recent price data, making it a dynamic indicator that responds quickly to market changes. When the 5 EMA crosses above the 10 EMA, it generates a bullish signal, indicating a potential upward trend. Conversely, when the 5 EMA crosses below the 10 EMA, a bearish signal suggests a possible downward trend. This strategy offers several advantages. Firstly, it helps traders filter out market noise and identify the prevailin
What is Average? A figure obtained by adding quantities/values and dividing the total by the number of quantities/values What is Moving Average? A moving average can be calculated in several ways. Every day, the 5 day simple moving average (SMA) adds the five most recent daily closing prices and divides the total by five to calculate a new average. Each average is connected to the next, resulting in one flowing line. What is 44 Moving Average? The 44 moving average is the average of the previous 44 candles formed on various time frames. It could be 1 minute, 5 minutes, 10 minutes, 15 minutes, or half an hour one day, week, or month. 44 moving average strategy works best when: When the 44 moving average keeps rising For buying, a green candle formed above the 44 MA. Short sell red candle formed below 44 MA Stocks in the Nifty 500 index When a stock is traded in huge volumes How to find stocks which are near 44 moving average? The most difficult part is to find the stocks which are n
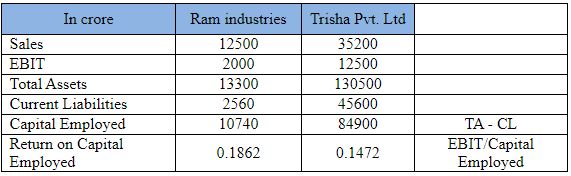
What Is Return on Capital Employed (ROCE)? Return on capital employed (ROCE) is a financial ratio used to analyse a company's profitability and capital utilisation. In other words, this ratio can help to identify how well a company generates profits from its capital as it is applied. ROCE is one of the many financial indicators available to financial managers, stakeholders, and retail investors when considering a company for investment. Higher ratios usually indicate that a company is profitable. · Income from investment a financial ratio that analyzes a business's profitability when all of its capital is put to use. · ROCE and return on invested capital are closely related concepts. In the end, the ROCE calculation reveals how much profit a business is making for every ₹1 of invested capital. The more profit a company can make for every ₹1, the better. Therefore, greater profitability across firm comparisons is indicated by a hig


Comments
Post a Comment